NTT Farm Economic Model (FEM)
NTT-FEM (Nutrient Tracking Tool Farm Economic Model) is a user-friendly component of the NTT program that simulates economic costs and benefits of changes in farm management practices after the initial NTT model has been executed. The FEM model simulates entire representative farms holistically, so regardless of the size of the farm, the FEM model captures the full economic effect of the scenario. A set of representative farms is already included within the NTT-FEM program for this purpose. After economic simulations are completed by FEM, the output can be viewed in the NTT program. The FEM results screen displays total revenue, total cost, and net returns. The FEM model estimates Total Revenue from crop sales by using the crop yield produced by the NTT model and the per unit crop selling price. Total Costs are estimated by FEM, using a wide array of subroutines, functions, and algorithms (Osei et al., 2000; for more information regarding FEM please refer to FEM technical documentation available in NTT program). For crop enterprises, the costs are estimated using various activities associated with crop production, such as land ownership costs, labor costs, machinery and equipment expenses, electricity charges, fuel prices, and fertilizer application costs. The third variable displayed in the results screen, Net Returns (also referred to as Net Income), is just the difference between Total Revenue to Total Cost. FEM also includes capabilities for simulating a wide spectrum of livestock operations.
The Economic Model Simulation
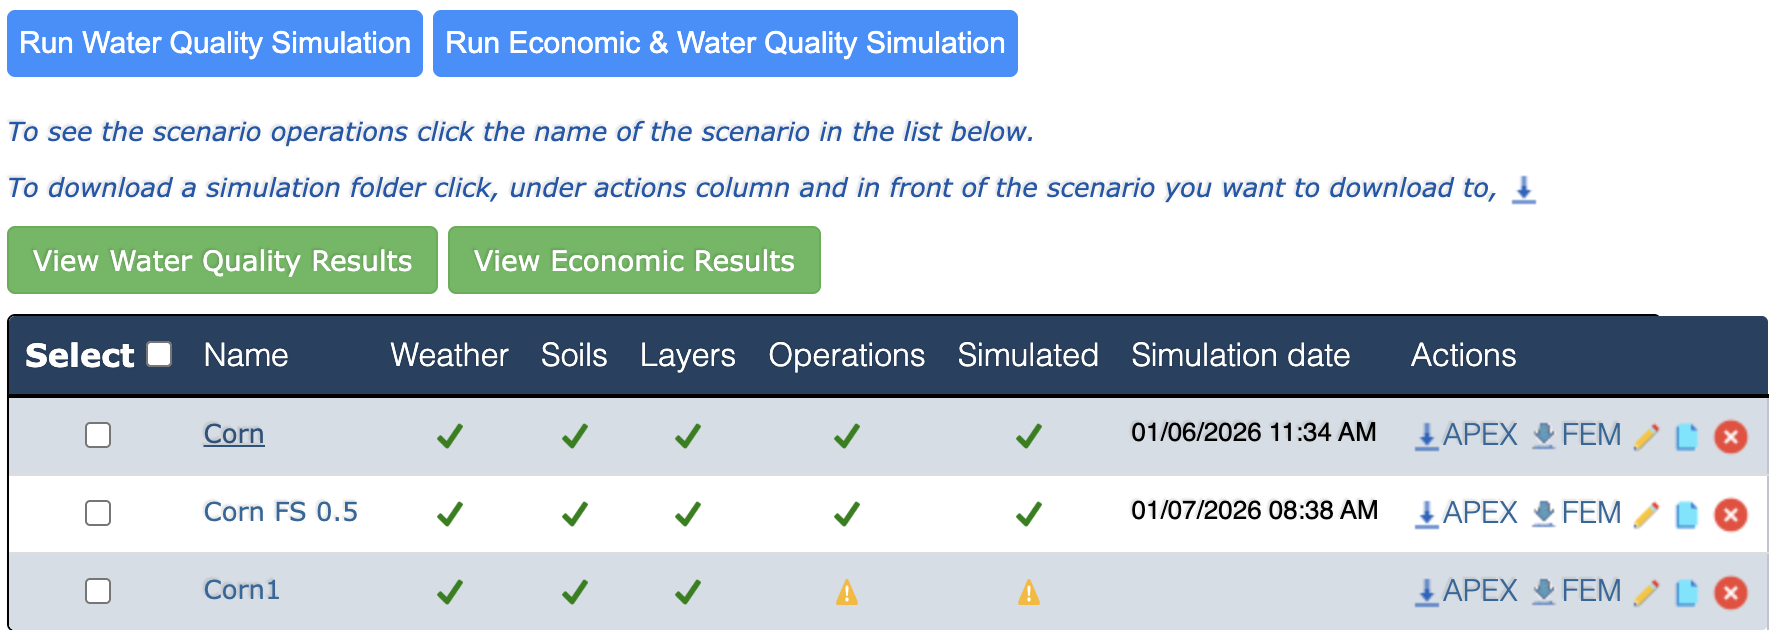
To estimate the economic effects of various crop management scenarios, users must select any scenario(s) by select the check box next to it, then click on the Economic & Water Quality Simulation tab to simulate both environmental and economic simulations. APEX must be run first in order to simulate the FEM program. The results obtained from APEX are used to evaluate economic impacts.
Resultados Económicos
The diagram illustrates the selection of two scenarios to determine their economic effects for a Corn and Alfalfa crop rotation. The Economic Results can be viewed by selecting the View Economic Results button.
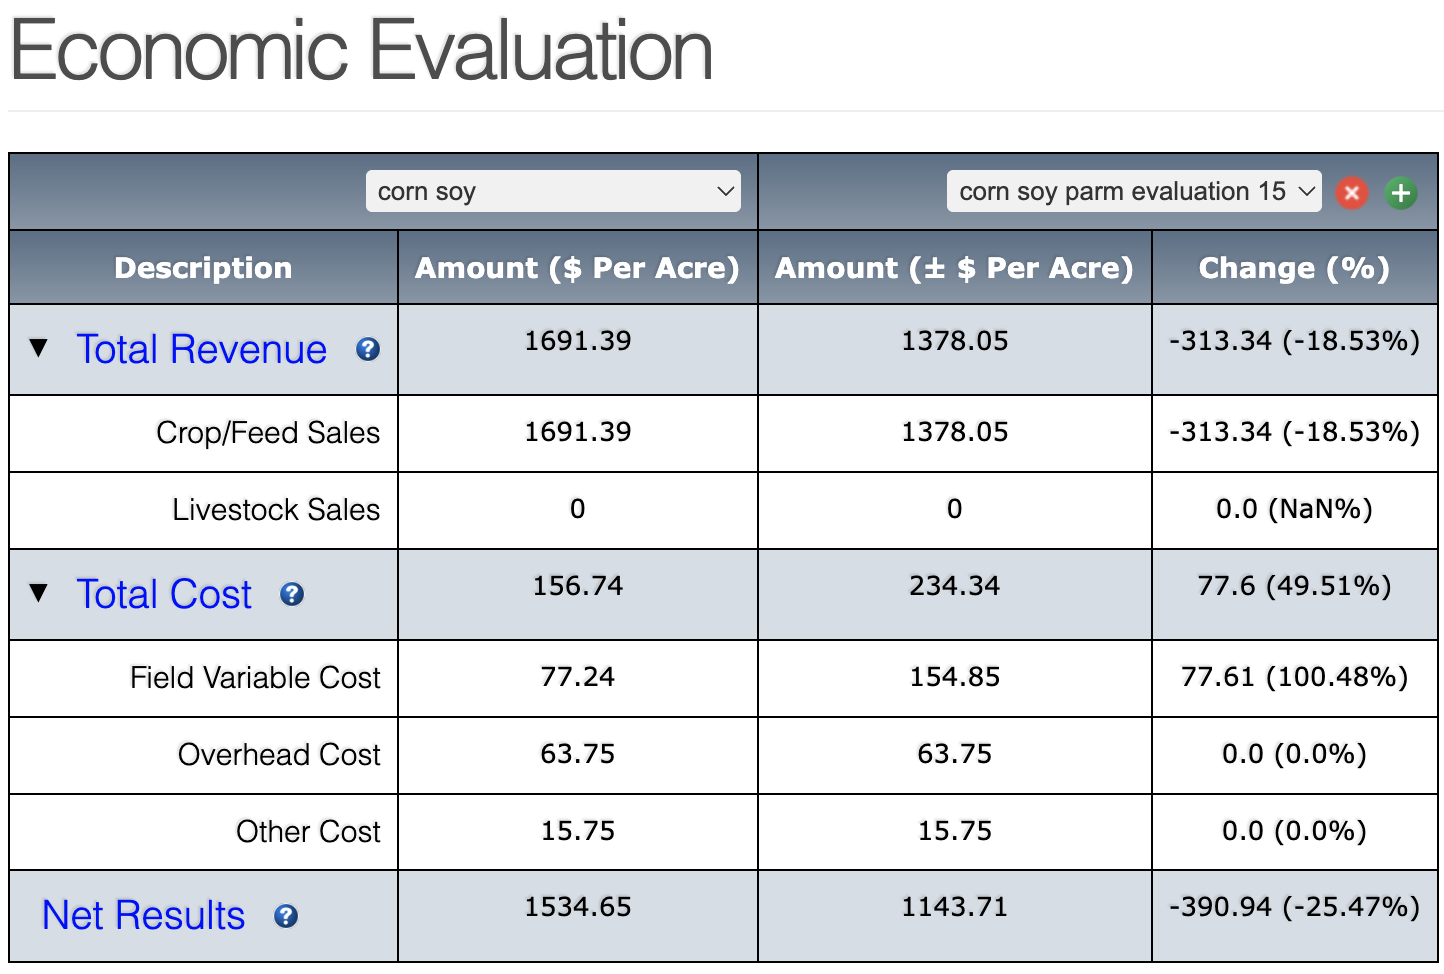
The first column in Figure 30 lists the categories of economic impacts associated with crop management options: Total Revenue (crop/feed and livestock sales), Total Cost, and Net Results. The remaining columns display the revenue from crop sales per acre (Total Revenue), the cost required to produce the crops in a unit acre of land (Total Cost), and the per acre net returns (Total Revenue minus Total Cost) for the baseline scenario and alternative scenarios. The Economic Results page also provides Field Variable Cost that includes machinery variable costs, additional fertilizer costs, and field labor costs. Overhead Cost includes principal and interest payments, and depreciation and cost of equity capital. Other Costs include feed costs, facility maintenance costs, crop input costs, land lease costs, livestock purchase costs, manure hauling costs, and other costs depending on the farm type.
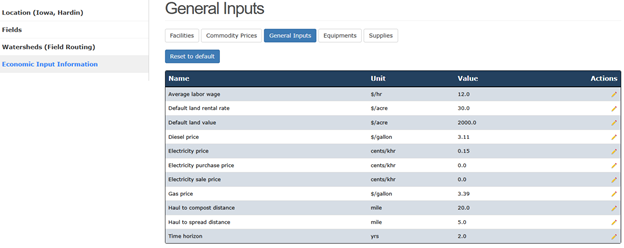
The economic costs, as described above, are estimated based on a national database developed by the NTT team at the Texas Institute for Applied Environmental Research (TIAER). However, since the specific economic input data varies from one location to another, NTT provides an option for users who wish to change certain input data to reflect their specific situations. Five tables are included in the “Economic Input Information” section of the NTT screen for editing input data. Users can change the values in each table as needed.
- The General Inputs table includes labor wages, land value, diesel and gasoline prices, and electricity price.
- The Commodity Prices table includes the purchase/selling price of feeds.
- The Equipment table includes equipment types and prices.
- The Facilities table presents the details of facilities used on the farm for various economic activities, such as barns, parlors, and feedlots.
- The Supplies table includes fertilizer and seed prices.
After modifications of any of the FEM input tables, users need to re-simulate the Economic & Water Quality models to see the effect of their modification(s).
Regresar a la Tabla de Contenidos < Anterior Siguiente >